Less Than Cummulative Frequecy Distribution


Less Than Cumulative Frequency Table
-Cumulative frequency curve or an ogive is the graphical representation of a cumulative frequency distribution. There are two methods of constructing an ogive
(i) Less than method (ii) More than method
(i) Less than method : - Following are the steps for construction of an ogive :
(a) Construct a cumulative frequency table of less than type.
(b) Mark upper class limits along X-axis.
(c) Mark the corresponding cumulative frequency along Y-axis.
(d) Plot the points where
is the upper limit of a class and
is the corresponding c.f. and join them by a smooth free hand curve.
The curve we get is the Less Than Type Ogive.
Illustration : - Draw an ogive for the following frequency distribution by less than method.
| Class Interval | 0-8 | 8-16 | 16-24 | 24-32 | 32-40 | 40-48 |
|---|---|---|---|---|---|---|
| Frequency | 8 | 12 | 20 | 16 | 8 | 10 |
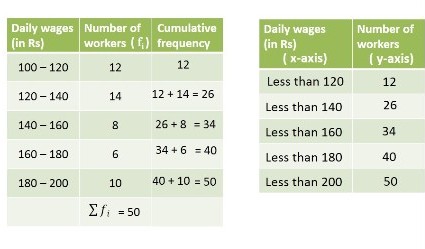
Solution : First we prepare a Less Than Type frequency distribution table.
| Class Interval | Cumulative Frequency |
|---|---|
| Less than 8 | 8 |
| Less than 16 | 8+12=20 |
| Less than 24 | 20+20=40 |
| Less than 32 | 40+16=56 |
| Less than 40 | 56+8=64 |
| Less than 48 | 64+10=74 |
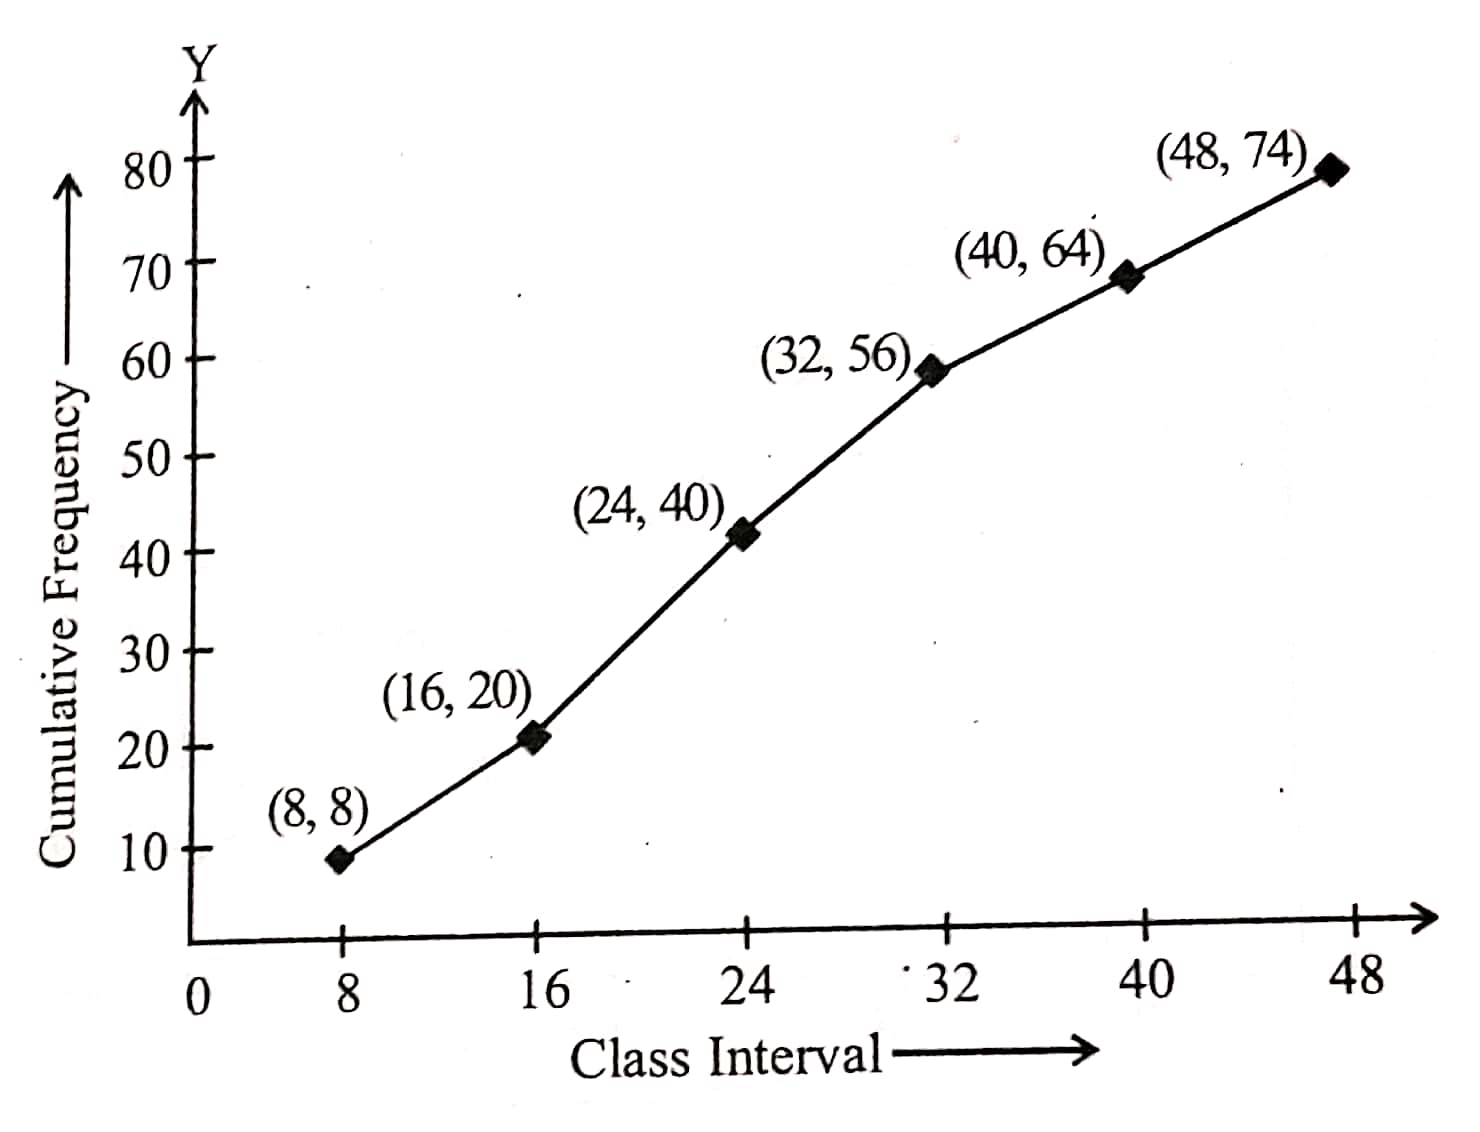
Now, mark the upper class limit on X-axis and frequency along Y-axis, plot the point (8,8), (16,20), (24,40), (32,56), (40,64) and (48,74). Join the points by smooth free hand curve to get required less than type ogive.
Students / Parents Reviews [10]
About Abhyas metholodology the teachers are very nice and hardworking toward students.The Centre Head Mrs Anu Sethi is also a brilliant teacher.Abhyas has taught me how to overcome problems and has always taken my doubts and suppoeted me.

Shreya Shrivastava
8thIt was a good experience with Abhyas Academy. I even faced problems in starting but slowly and steadily overcomed. Especially reasoning classes helped me a lot.

Cheshta
10thMy experience was very good with Abhyas academy. I am studying here from 6th class and I am satisfied by its results in my life. I improved a lot here ahead of school syllabus.

Ayan Ghosh
8thIt was good as the experience because as we had come here we had been improved in a such envirnment created here.Extra is taught which is beneficial for future.

Eshan Arora
8thI have spent a wonderful time in Abhyas academy. It has made my reasoning more apt, English more stronger and Maths an interesting subject for me. It has given me a habbit of self studying

Yatharthi Sharma
10thOne of the best institutes to develope a child interest in studies.Provides SST and English knowledge also unlike other institutes. Teachers are co operative and friendly online tests andPPT develope practical knowledge also.

Aman Kumar Shrivastava
10thA marvelous experience with Abhyas. I am glad to share that my ward has achieved more than enough at the Ambala ABHYAS centre. Years have passed on and more and more he has gained. May the centre flourish and develop day by day by the grace of God.

Archit Segal
7thMy experience with Abhyas is very good. I have learnt many things here like vedic maths and reasoning also. Teachers here first take our doubts and then there are assignments to verify our weak points.

Shivam Rana
7thMy experience with Abhyas academy is very good. I did not think that my every subject coming here will be so strong. The main thing is that the online tests had made me learn here more things.

Hiya Gupta
8thIt has a great methodology. Students here can get analysis to their test quickly.We can learn easily through PPTs and the testing methods are good. We know that where we have to practice